Line Charts
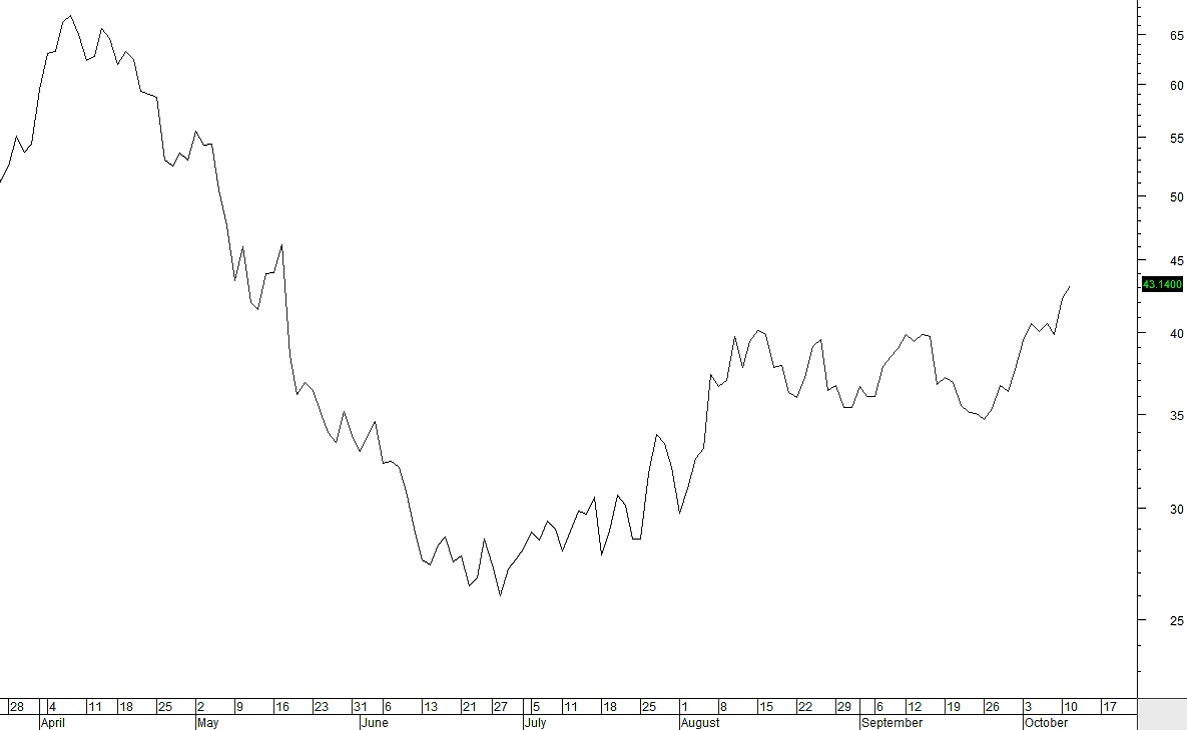
Line Charts Line charts are the oldest charts used for analysis of stocks, indexes, and the financial markets. Line charts are exactly what the name implies: a line that moves up and down on the chart. Line charts were drawn by hand by early technical analysts as a means of understanding price action over time. What is a Line Chart? The line chart uses one of the four components of price in a specific time frame.
For a daily chart as an example, the line chart uses only the end of day or closing price for that stock. The line chart excludes the open price, high price, and low price for that day. The closing price was chosen for the line chart as the basis for technical analysis because most experts believe that the closing price is the most important price for the day.

How to use a Line Chart
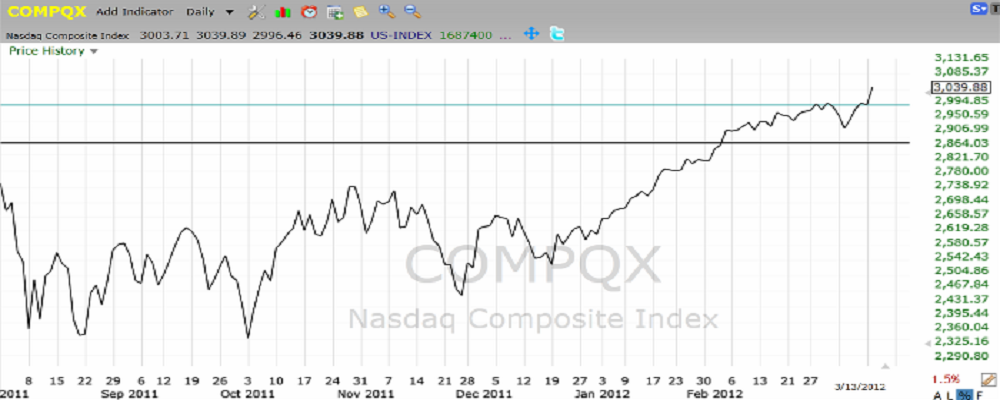
The line chart can be used on any time frame. Below the chart is a Daily Line Chart. Each day, the closing price is used to create the addition to the chart in a line graph. If the stock or index in this case, moves up and closes higher for that day, then the line moves up, if the stock or index, price closes lower, the line will move down on the chart. The number of points the index moved for that day defines how long the line is for that day. So long lines indicate many points moved for that day.

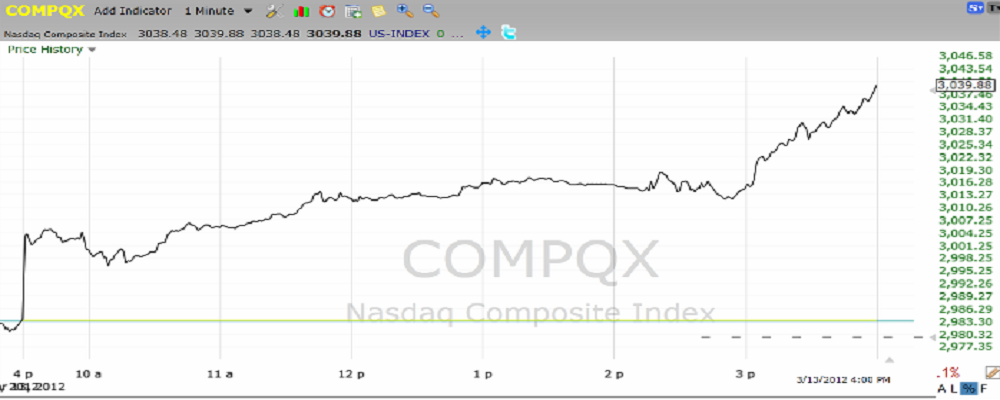
Any time frame from 1 minute to 1 year can be used to create a line chart. Below the NASDAQ 100 Composite Index Line chart is a 1 minute chart. The line chart shows that on this particular day, the price values for the Nasdaq rose quickly in the first few minutes after the market opened, then for most of the day, the price held relatively flat not moving up or down much. In the final few hour of trading for that day, price began moving up with only a few minutes when it moved down.

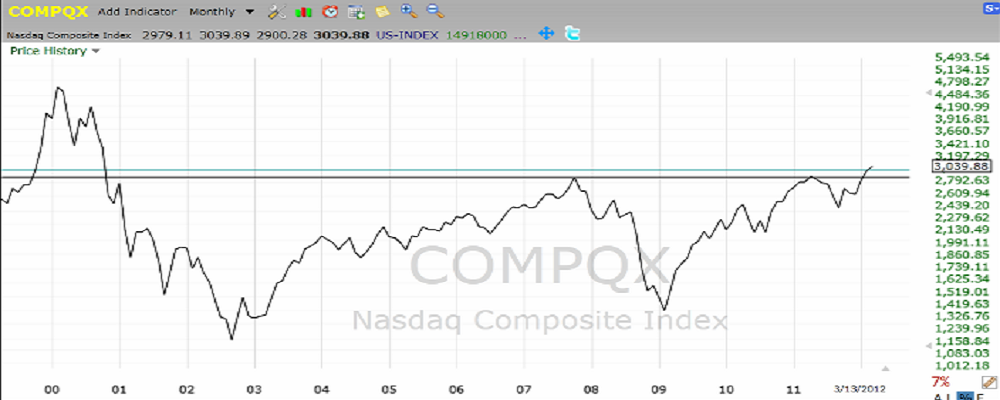
Below is a monthly line chart of the NASDAQ 100 Composite Index

A monthly line chart is most useful to the long term investor for retirement portfolio management.
When to use Line Charts
Line charts are primarily used for analyzing the long term trend. Most of the time the best view of a long term trend will be either a monthly or weekly line chart. The line chart provides a clean, uncluttered view of the long term trend, the angle of ascent of the long term trend, and historical information that is extremely useful for long term trend analysis. Line Charts are not as useful to the short term trader who needs a more detailed chart that provides far more information to trade stocks or indexes for short term profits.
A short term trader should use either Bar Charts or Candlestick Charts for entries and exits on short term trades. Where to find Line Charts: Most charting software offers line charts as one of the types of charts in their programs. The selection of chart types is usually found under “chart properties” or “chart type”.
Summary:
Line Charts are the oldest type of chart used by financial markets. They were first used in stock analysis over a century ago. The first line charts were drawn by hand. Computers have made charting easier and most software programs offer line charts as one of the types available for analysis. Line charts are best suited for analyzing the long term trend of a stock or index. Line charts are less useful for short term traders who need a more detailed analysis of price action than line charts can provide. All computer generated line charts use the closing price or end of day price for the line creation.
If you are new to using stock charts, the line chart is a good place to start to become familiar with how a stock chart looks and what information it provides in a graphical or visual image. Stock Charts are an essential tool that all investors and traders must use in our automated marketplace. Stock charts help investors and traders a picture of what has happened to price for a stock or index. Line charts are just one of the many types of stock charts available to traders and investors. Using line charts properly will help you trade better and will improve your portfolio growth.


